 From the NOAA Global Climate Report – Annual 2019:
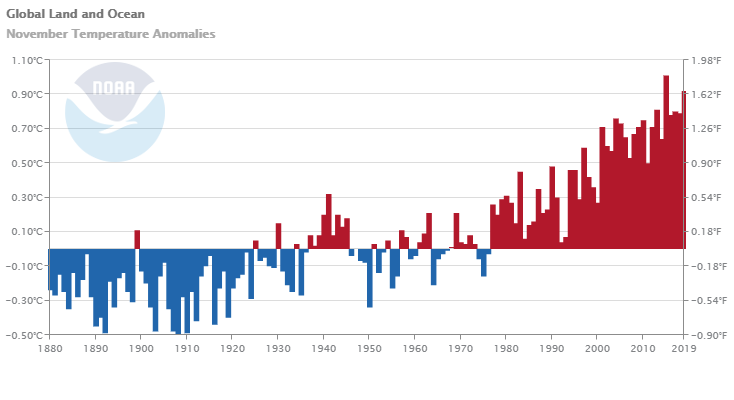
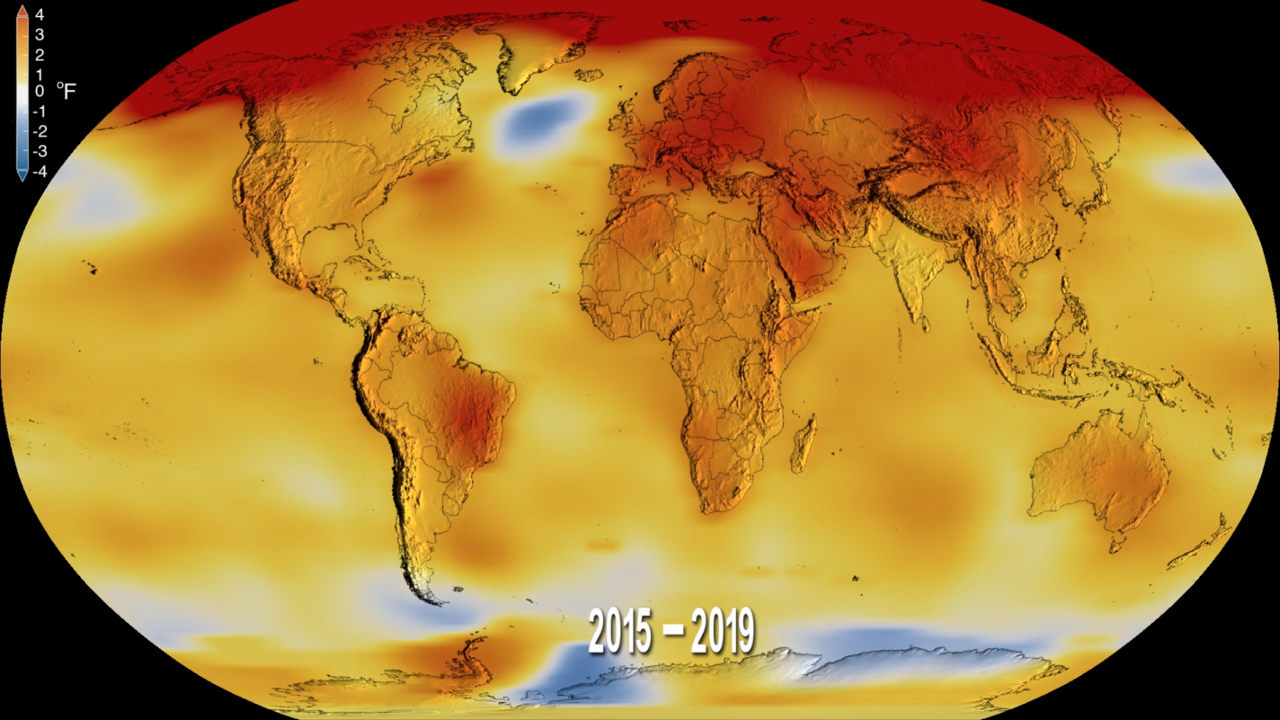
The year 2019 was the second warmest year in the 140-year record, with a global land and ocean surface temperature departure from average of +0.95°C (+1.71°F). This value is only 0.04°C (0.07°F) less than the record high value of +0.99°C (+1.78°F) set in 2016 and 0.02°C (0.04°F) higher than the now third highest value set in 2015 (+0.93°C / +1.67°F). The five warmest years in the 1880–2019 record have all occurred since 2015, …
The report contains summaries by region and has abundance of quantitative information such as:
North America was the only continent that did not have an annual temperature that ranked among its three highest on record. Overall, North America’s temperature was 0.90°C (1.62°F) above the 1910–2000 average, marking the 14th warmest year in the 110-year continental record. The yearly temperature for North America has increased at an average rate of 0.13°C (0.23°F) per decade since 1910; however, the average rate of increase is more than twice as great (+0.29°C / +0.52°F per decade) since 1981.
The graphic here is from NASA, NOAA Analyses Reveal 2019 Second Warmest Year on Record (1/15/2020). Time series data can be obtained from Climate at a Glance Global Time Series.