 Climate Central has put together their 2020 Spring Package (2/2/2020) with information and a selection of city graphs. For example
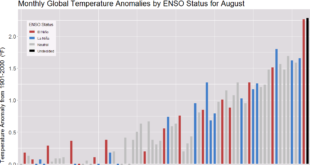
Analyzing average spring temperatures since 1970, the top increases occurred in the Southwest—where spring is the fastest warming season. Reno, Nev. topped the list with an increase of 7.2°F, followed by Las Vegas, Nev. (6.4°F), El Paso, Texas (5.8°F), and Tucson (5.8°F). In general, 81% (197) of the 242 cities analyzed warmed by at least 1°F over the past fifty years.
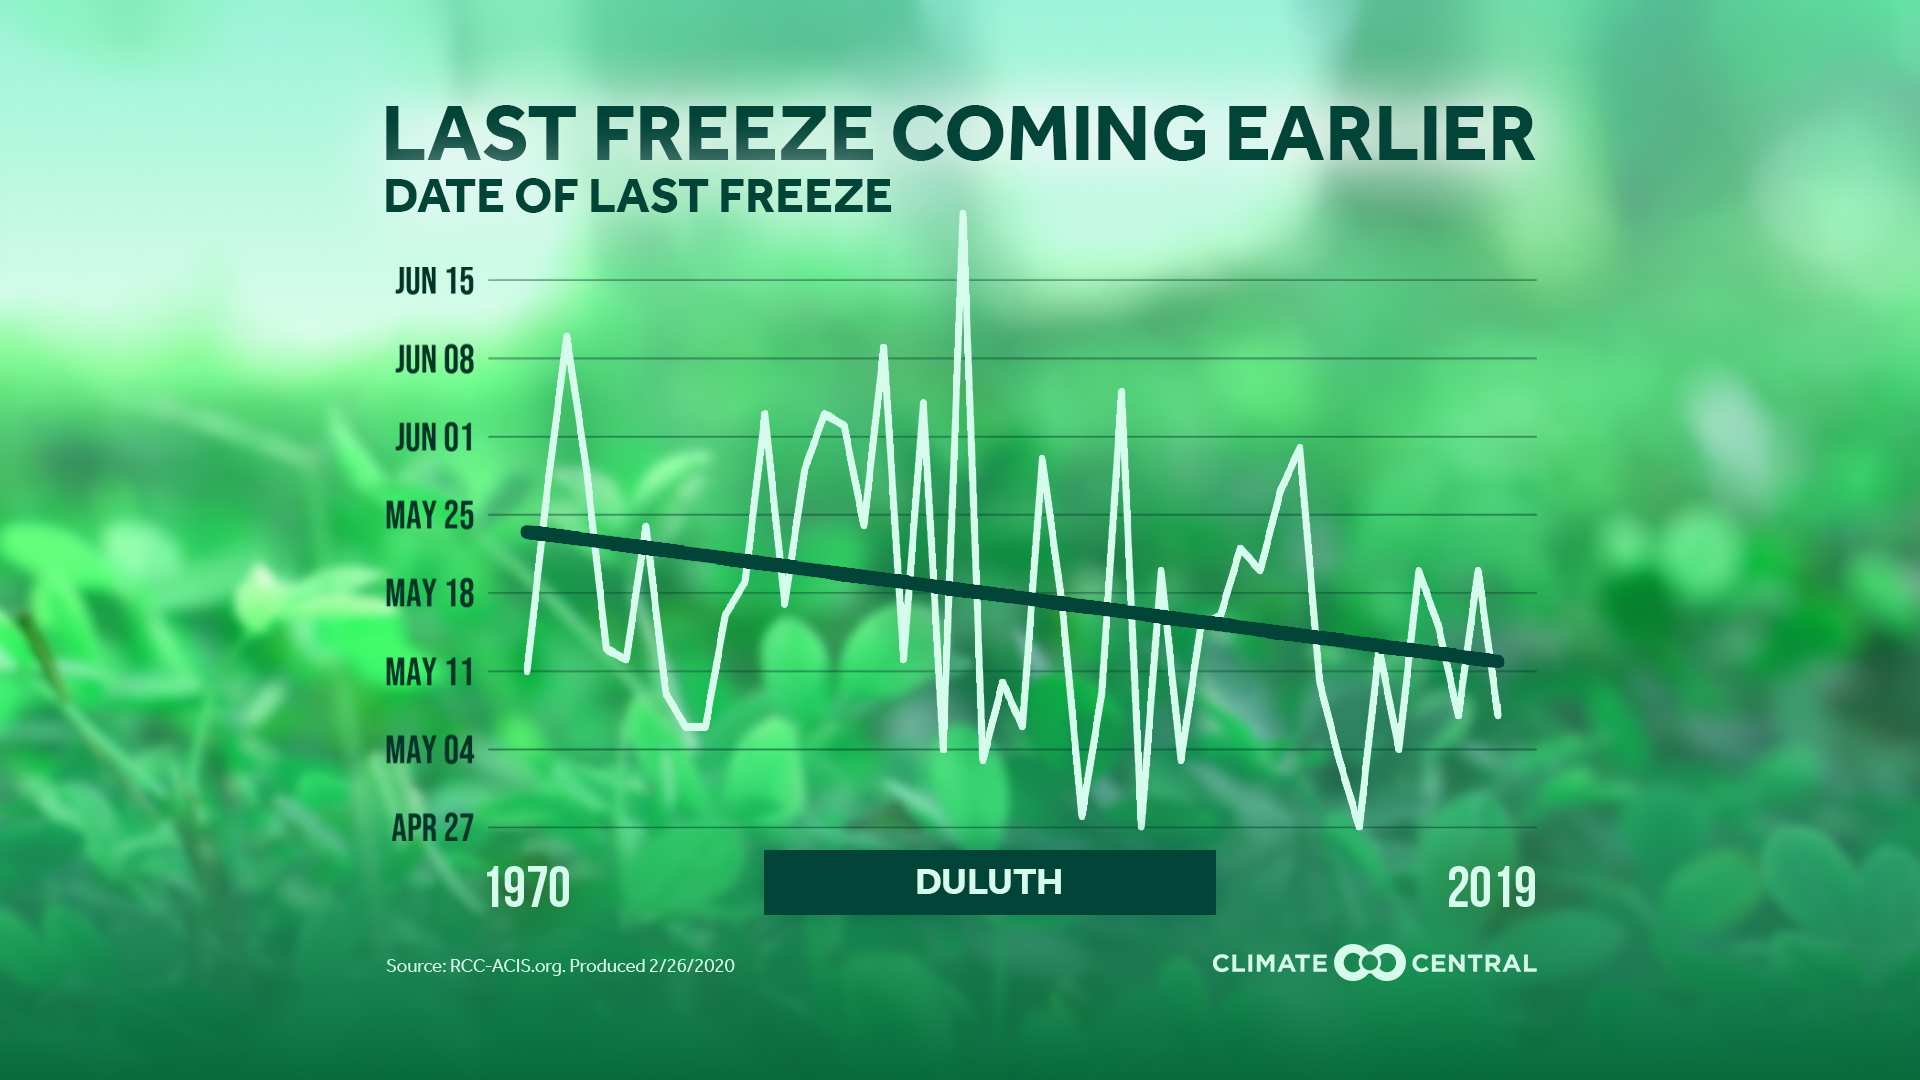
There are four different graph selections for spring: Average Temperature, Days Above Normal, Last Freeze, and a National Map. For the first three you can select from various cities. For example, I chose the graph for last freeze for Duluth, MN, which shows that on average the last freeze is occurring almost two weeks sooner.
The graphs are set up for easy download but there isn’t corresponding data. A previous post How much have fall nighttime temperatures risen? provides details on how to obtain this type of data.