 From the NOAA Global Climate Report – May 2020:
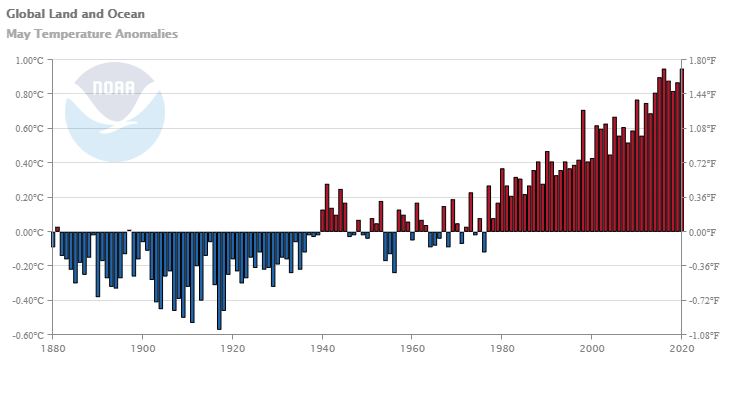
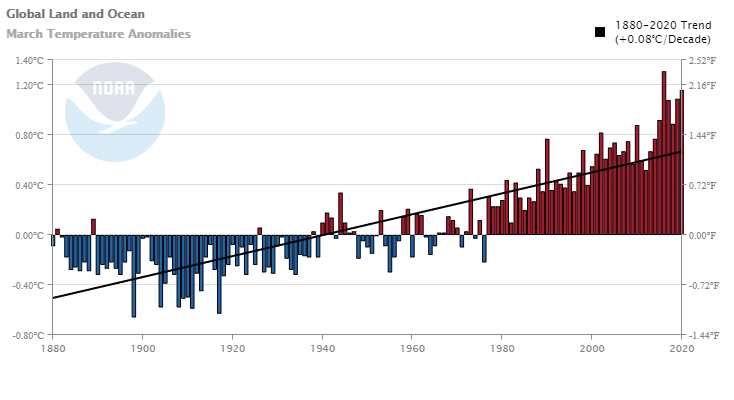
The global land and ocean surface temperature for May 2020 tied with 2016 as the highest in the 141-year record at 0.95°C (1.71°F) above the 20th century average of 14.8°C (58.6°F). The 10 warmest Mays have all occurred since 1998; however, the 2014–2020 Mays are the seven warmest in the 141-year record. May 2020 also marked the 44th consecutive May and the 425th consecutive month with temperatures, at least nominally, above the 20th century average.
The global land-only surface temperature for May 2020 was also the highest on record at 1.39°C (2.50°F) above the 20th century average of 11.1°C (52.0°F). This was 0.04°C (0.07°F) above the previous record set in 2012. The 10 highest May global land-only surface temperature departures have occurred since 2010.
The May 2020 global ocean-only surface temperature was near-record warm at 0.79°C (1.42°F) above average. This value was only 0.01°C (0.02°F) shy of tying the record warm May of 2016.
May time series data here. Climate.gov provides a summary of May 2020 in their post Was May 2020 warm and dry or cool and wet across the U.S.? It depends… by Rebecca Lindsey (6/9/2020)

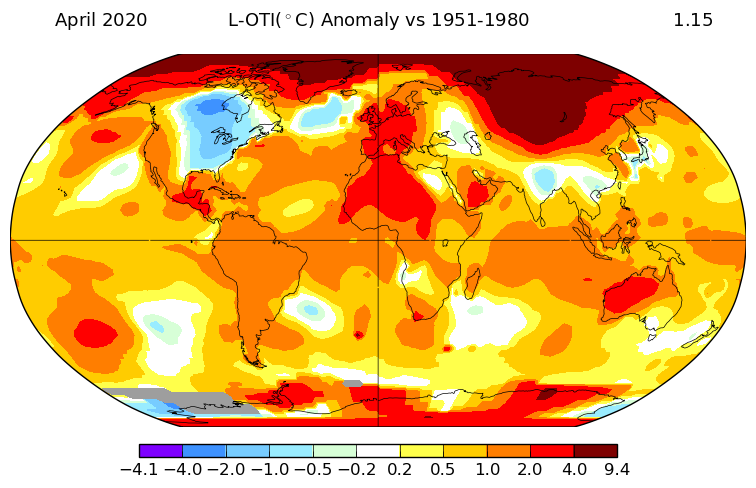
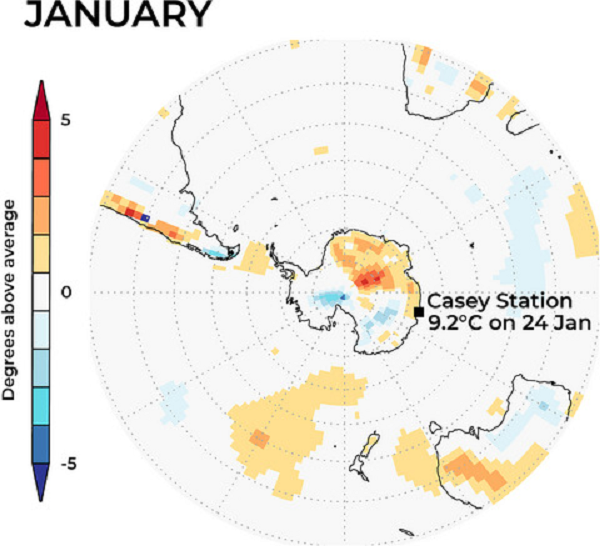

 No, as can be easily seen by the graphic here copied from the NASA article