Tag Archives: inequality

How different is weekly pay of women and men by race?

The BLS report, Highlights of women’s earning in 2017 has four charts with data about women’s earnings and occupation.  The chart copied her compares men and women by race.

Asian women and men earned more than their White, Black, and Hispanic counterparts in 2017. Among women, Whites ($795) earned 88 percent as much as Asians ($903); Blacks ($657) earned 73 percent; and Hispanics ($603) earned 67 percent. Among men, these earnings differences were even larger: White men ($971) earned 80 percent as much as Asian men ($1,207); Black men ($710) earned 59 percent as much; and Hispanic men ($690), 57 percent. (See chart 3 and table 1.)

Note:

The earnings comparisons in this report are on a broad level and do not control for many factors that can be important in explaining earnings differences, such as job skills and responsibilities, work experience, and specialization.

The BLS is an excellent source for data.

How is wealth accumulated?

The Census Bureau note, Many U.S. Households Do Not Have Biggest Contributors to Wealth: Home Equity and Retirement Accounts by Jonathan Eggleston and Donald Hays (8/27/19), highlights gaps in wealth by household type.

Wealth inequality between homeowners and renters is striking: Homeowners’ median net worth is 80 times larger than renters’ median net worth.

In 2015, 37% of households did not own a home and 47.1% of households did not have a retirement account. This gap in two key assets contributes to wealth inequality.

The chart here comes from the report linked to in the note, New Worth of Households: 2015. For the “typical” household the home accounts for almost 35% of wealth. Two other statistics from the note:

Non-Hispanic white and Asian householders had more household wealth than black and Hispanic householders. Non-Hispanic whites had a median household wealth of $139,300, compared with $12,780 for black householders and $19,990 for Hispanic householders. Asians had a median household wealth of $156,300, which is not statistically different from the estimate for non-Hispanic whites.

Higher education is associated with more wealth. Households in which the most educated member held a bachelor’s degree had a median wealth of $163,700, compared with $38,900 for households where the most educated member had a high school diploma.

The note links to Detailed Tables:2015 which provides extensive demographic information regarding wealth.

How are CEOs doing?

The EPI article, CEO compensation has grown 940% since 1978 by Lawrence Mishel and Julia Wolfe (8/14/2019), summarizes CEO compensation.  Selected Key findings:

Using the stock-options-realized measure, we find that the average compensation for CEOs of the 350 largest U.S. firms was $17.2 million in 2018. Compensation dipped 0.5% in 2018 following a 7.6% gain in 2017.

The fact that CEO compensation has grown far faster than the pay of the top 0.1% of wage earners indicates that CEO compensation growth does not simply reflect a competitive race for skills (the “market for talent”) that also increased the value of highly paid professionals: Rather, the growing differential between CEOs and top 0.1% earners suggests the growth of substantial economic rents in CEO compensation (income not related to a corresponding growth of productivity). CEO compensation appears to reflect not greater productivity of executives but the power of CEOs to extract concessions. Consequently, if CEOs earned less or were taxed more, there would be no adverse impact on the economy’s output or on employment.

Over the last three decades, CEO compensation increased more relative to the pay of other very-high-wage earners than did the wages of college graduates relative to the wages of high school graduates. This finding indicates that the escalation of CEO pay does not simply reflect a more general rise in the returns to education.

There are six tables/graphs in the article and the data is available for download.

What are the economic prospect for 2019 high school grads?

EPI has its annual report on the prospects for 2019 high school grads.  Class of 2019 High school edition by Elise Gould, Julia Wolfe, and Zane  Mokhiber (6/6/19) has 17 key findings and 11 graphs with data.  For example, their graph here (figure I) gives hourly wages in 2018 dollars for high school graduates not enrolled in further schooling.  As compared to 2000 wages for men as well as Black high school graduates are lower; all other groups have gone up. In fact, Hispanics make more than all other groups, including White graduates.

A few other highlights from the key findings:

Asian Americans/Pacific Islanders are significantly more likely to have begun on the college path at this age than any other racial/ethnic group.

Young black high school graduates are roughly twice as likely to be unemployed as their white and AAPI peers.

Average wages for young high school graduates recently surpassed their 2007 level, but remain just below their 2000 level, representing two lost decades of wage growth.

Black students (that go on to college) take on a disproportionate amount of debt, in part because their families generally accumulate less wealth than white families.

The entire report is worth reading.

Related post: What are the prospects for high school grads?

Where do we buy our food?

How you answer the question of where do you buy your food probably says a lot about your socioeconomic status. The chart here is from the Business Insider article Here’s where Americans are buying their groceries by Hayley Peterson (6/21/17).  Note that CVS, Walgreens, Dollar Tree, and Dollar General each outsell Whole Foods, for example. Why does this matter? The recent Guardian article Fears grow over ‘food swamps’ as drugstores outsell major grocers by Gabrielle Cannon (6/4/19) provides context.

Shelf-stable options tend to be highly processed and high in fat, sodium and sugar. Where they are the easiest option available, communities experience higher rates of chronic illness, like diabetes, heart disease and cancer.

“Highly processed food makes you sick,” says William McCarthy, an adjunct professor of public health at UCLA. “CVS and other pharmacies make money selling highly processed, long shelf-life foods, because it is all convenient.” But, he says, his research has shown that it’s not just about having more healthy options.

Interestingly,

In a 2016 study, researchers stocked corner stores in “food swamps” across East Los Angeles with affordable produce, hoping to test whether food retail interventions could be successful. They weren’t. While perceptions of the stores and community accessibility changed, patrons continued to purchase processed food instead of the fresh stuff.

Grocery sales data is available for 2018 (estimated) from the Winsight Grocery Business article WGB, Kantar Reveal ‘The Power 20’ Retailers by Meg major and Jon Springer (7/17/2018). They estimate CVS as fourth in grocery sales with Dollar General and Dollar Tree at 12 and 17, respectively. The Guardian article links to a couple of studies with statistical information suitable for a stats course.


How has the economic situation of college students changed?

The Pew article A Rising Share of Undergraduates Are From Poor Families, Especially at Less Selective Colleges, by Richard Fry and Anthony Cilluffo (5/22/19) summarizes the change in the economic background of students from 1996 to 2016.

As of the 2015-16 academic year (the most recent data available), about 20 million students were enrolled in undergraduate education, up from 16.7 million in 1995-96.1 Of those enrolled in 2015-16, 47% were nonwhite and 31% were in poverty, up from 29% and 21%, respectively, 20 years earlier.2

The rising proportion of undergraduates in poverty does not mirror wider trends in society. The official poverty rate for adults age 18 to 64 (12%) was similar in 1996 and 2016, suggesting that access to college for students from lower-income backgrounds has increased since 1996.

As the graph copied here shows:

The growth in the share of dependent students from families in poverty has been uneven across postsecondary education. Their growing presence has been most dramatic among less selective institutions.

The article has a eight charts, a methodology section, and links to the data sources.

Are there correlations between one or more deceased parents and race, gender, or socio-economic status?

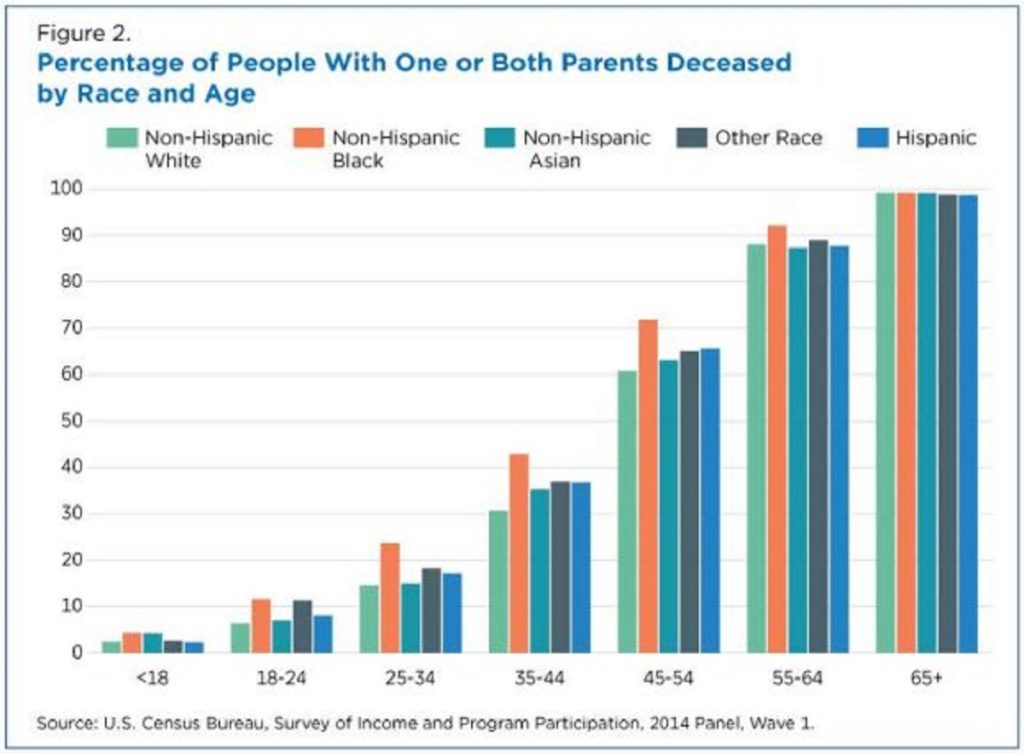
The Census Bureau report Parental Mortality is Linked to a Variety of Socio-economic and Demographic Factors by Zachary Scherer (5/6/19) provides charts of deceased parent(s) by sex, race (chart copied here), and socio-economic status.

For example, among those ages 45 to 49, 26% have lost their mother, while 45% have lost their father. Along these same lines, 7 in 10 of those ages 60 to 64 have a deceased mother, while about 87% have lost their father.

For example, among those ages 35 to 44, 43% of those living below the FPL have lost one or both parents, compared to 28% for those living in households with an income-to-poverty ratio of at least 400% of the FPL.

Parental loss, which varies by race and socio-economic status, is often accompanied by psychological and material consequences. These statistics demonstrate the way these new SIPP data can help assess how socio-economic and demographic characteristics are associated with parental mortality in the United States.

There are two other charts and a link to the SIPP data source.


Why is Black maternal mortality higher?

Kevin Drum provides an excellent example of quantitative reasoning in his (5/6/19) post How Can We Reduce Black Maternal Mortality? The story begins with his chart here that shows maternal mortality increasing in general, but it has increased faster and is much higher for Black mothers as compared to White. Drum begins by addressing the toxic stress hypothesis, in other words, the differences are do to the stress caused by societal and systemic racism which leads to physiological issues.  But,

One reason for this is the “Hispanic paradox”: Hispanics certainly encounter systemic racism too, but the maternal mortality rate for Hispanic mothers is about the same as for white mothers.

The article has a graph of “allostatic load” which looks to quantify long-term stress.

The differences in allostatic load are tiny—about the equivalent of one IQ point on an intelligence test—and Hispanics have a higher allostatic load than either blacks or whites but the lowest maternal mortality rate.

Another chart looks at self-reported stress by race for poor individuals, but

Poor blacks report less stress and higher levels of optimism than both poor whites and poor Hispanics. Put all this together and the toxic stress/weathering hypotheses look shaky. The racial differences are modest and don’t seem to correlate well with maternal mortality anyway. The problem is that every other hypothesis seems wrong too. Researchers have looked at poverty, education, drinking, smoking, and genetic causes. None of them appear to be the answer.

There are two more charts as part of Drum’s article. The article is worth reading, he cites his data, and is it perfect for a QL based course. His general conclusion at this point:

This is shocking: we still have almost no idea of what’s going on even though this has been a well-known problem for more than two decades.


How do we humanize data?

When comparing countries or even within countries, we can talk about GDP, Gini coefficients, poverty rates, etc., but sometimes (all the time?) it is hard to know what this really means for people. If a picture is worth a 1000 words then Dollar Street has 30,000,000 words as they “visited 264 families in 50 countries and collected 30,000 photos” resulting in an excellent example of humanizing data.

The pictures here represent the bathroom for a family in India earning $4621 per month and for a family in Egypt earning $775 per month (which is which?).  Dollar Street has large sets  of pictures like this from around the work for over 100 different categories such as armchairs, beds, computers, earrings,  floors, hands, ovens, and plates.  Difference can be explored by picture within countries or the world. These sets of pictures provide both a sense of what poverty is really like around the world, while at the same time there are much more similarities than one might expect even with seemingly large gaps in income. Take the time to visit Dollar Street.

What are the differences in the college aspirations of teens?

Pew reports results of a detailed survey in their article Most U.S. Teens See Anxiety and Depression as a Major Problem Among Their Peers — For boys and girls, day-to-day experiences and future aspirations vary in key ways by Juliana Menasce Horowitz and Nikki Graf (2/20/19). Here, we highlight college aspirations:

Girls are more likely than boys to say they plan to attend a four-year college (68% vs. 51%, respectively), and they’re also more likely to say they worry a lot about getting into the school of their choice (37% vs. 26%). Current patterns in college enrollment among 18- to 20-year-olds who are no longer in high school reflect these gender dynamics. In 2017, 64% of women in this age group who were no longer in high school were enrolled in college (including two- and four-year colleges), compared with 55% of their male counterparts.

There are also differences by parental education and economic class:

Among teens with at least one parent with a bachelor’s degree or higher, as well as those in households with annual incomes of $75,000 or more, about seven-in-ten say they plan to attend a four-year college after high school. By comparison, about half of teens whose parents don’t have a bachelor’s degree or with household incomes below $75,000 say the same.

The article has a number of other charts and a detailed methodology section (perfect for a stats  course).