Tag Archives: QL

Why is Black maternal mortality higher?

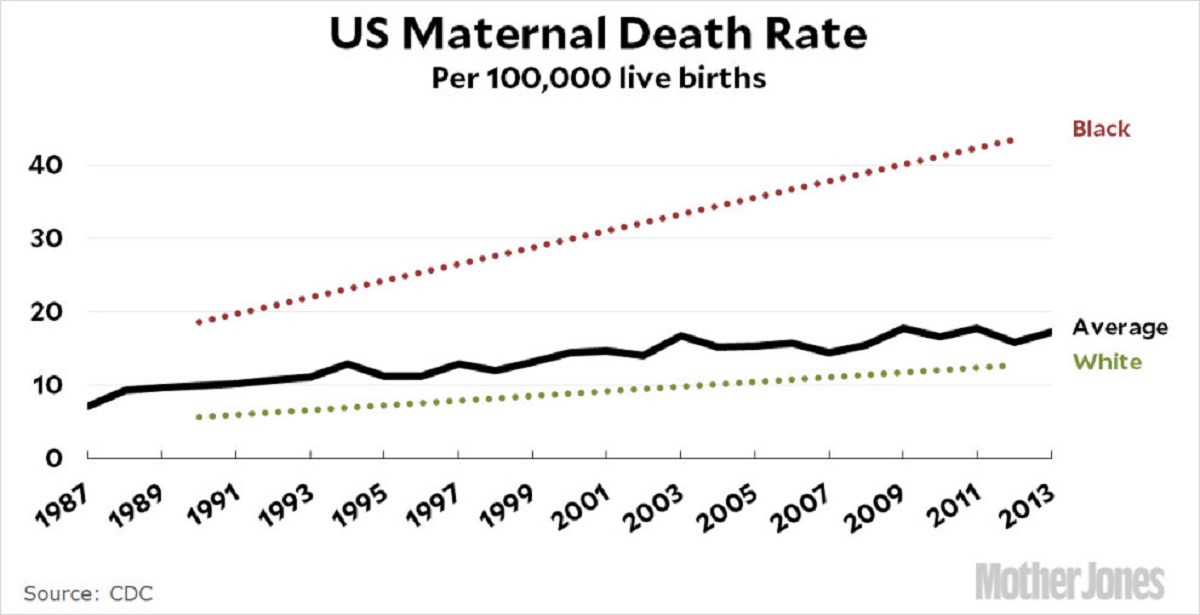
Kevin Drum provides an excellent example of quantitative reasoning in his (5/6/19) post How Can We Reduce Black Maternal Mortality? The story begins with his chart here that shows maternal mortality increasing in general, but it has increased faster and is much higher for Black mothers as compared to White. Drum begins by addressing the toxic stress hypothesis, in other words, the differences are do to the stress caused by societal and systemic racism which leads to physiological issues.  But,

One reason for this is the “Hispanic paradox”: Hispanics certainly encounter systemic racism too, but the maternal mortality rate for Hispanic mothers is about the same as for white mothers.

The article has a graph of “allostatic load” which looks to quantify long-term stress.

The differences in allostatic load are tiny—about the equivalent of one IQ point on an intelligence test—and Hispanics have a higher allostatic load than either blacks or whites but the lowest maternal mortality rate.

Another chart looks at self-reported stress by race for poor individuals, but

Poor blacks report less stress and higher levels of optimism than both poor whites and poor Hispanics. Put all this together and the toxic stress/weathering hypotheses look shaky. The racial differences are modest and don’t seem to correlate well with maternal mortality anyway. The problem is that every other hypothesis seems wrong too. Researchers have looked at poverty, education, drinking, smoking, and genetic causes. None of them appear to be the answer.

There are two more charts as part of Drum’s article. The article is worth reading, he cites his data, and is it perfect for a QL based course. His general conclusion at this point:

This is shocking: we still have almost no idea of what’s going on even though this has been a well-known problem for more than two decades.


What is earth overshoot day?

According to Earth Overshoot Day:

Earth Overshoot Day marks the date when humanity’s demand for ecological resources and services in a given year exceeds what Earth can regenerate in that year. We maintain this deficit by liquidating stocks of ecological resources and accumulating waste, primarily carbon dioxide in the atmosphere.

The graph here is from statista and is from data posted by Earth Overshoot Day.  The Earth Overshoot website has useful materials for teachers.

Should you move to Duluth, MN?

(Chart by Rebecca Pollock and Jon Erdman, data from Climate Central/RCC-ACIS.org)


The Weather Channel article It’s the Year 2100 and Everyone’s Moving to Duluth by Neil Katz (4/16/19) notes

In a climate-changed future many people, says Keenan, “are looking for affordability, accessibility and actually qualitatively some degree of environmental amenities, which we believe Duluth, Lake Superior, and that part of northeast Minnesota, among other places may offer.”

Huttner is right to point out that winter weather in Duluth remains brutally cold, snowy and difficult. But it is changing, and it’s changing faster than many other places. Winters are now five degrees warmer than they were in 1970, according to NOAA data analyzed by Climate Central.

The Weather Channel isn’t the only one praising Duluth as a future place to live. The NYT article Want to Escape Global Warming? These Cities Promise Cool Relief by Kendra Pierre-Louis (4/15/19) lists Duluth and Buffalo as cities of the future (Note: Both articles quote Keenan, a lecturer at Harvard University Graduate School of Design). The Weather Channel article has a couple of nice charts (such as the one copied here) and both are a starting point for conversations about adapting to climate change.

PS On a personal note, I lived in the Twin Ports (Duluth MN and Superior WI) for a couple of years around 2000. Beautiful place.


How do we visualize changing temperature distributions?

This recent video (3/29/19) by Robert Rohde shows how temperature distributions have changed. Each year the graph is a distribution of temperature anomalies.  As noted “This essentially the same data that was previous shown as an animated map:”  https://www.youtube.com/watch?v=JObGveVUz7k  The video here is useful in any statistics or QL course and the two videos together provide an illustration of how to display data. The data is from Berkeley Earth.

What is the state of Arctic Ice?

The melting season for Arctic Sea Ice has started with a quick drop in ice. The total ice is at a record low for this time of year (orange line in chart). But, how this plays out throughout the melting seasons is hard to predict based solely on past seasons. For instance, 2012 is the year of the record low (dashed line), but numerous seasons have been lower than 2012 at this time of year (2016 – yellow, 2015 – green, 2007 – blue shown here).  Arctic Sea Ice extent is updated daily on the Charctic Interactive Sea Ice Graph by NSIDC. This graph allows the user to select years, download the image, and choose between Arctic and Antarctic ice extent. NSIDC posts the data and there is a project on both the Calculus and Statistics page using this data, as well as an interactive graph.

What’s new at sustainabilitymath?

There are three more interactive graphs on the Interactive Graphs page for a total of five.  One is Arctic Sea Ice extent by year for the months of March (high month), June, September (low month), and December, along with regression lines and residual plots (snapshot here). The other two represent the expected years to live at a given age. One of these is by race and gender, while the other is all females and males. Both graphs include a regression line and residual plot. The purpose of these graphs is to not only be interesting and informative, but to also be useful as classroom resource for projects or exercises.

What is Population Bracketology?

The Census Bureau has a new interactive data visualization called Population Bracketology (see the screen shot here). In the game, players have to choose the city (or state for the state version) with the largest population.  Once the game is completed users can scroll over the cities (or states) to get the size of their population.  So, how much do you know about city and state population sizes? Play the game and find out.

How will raising the federal minimum wage impact workers?

The EPI article, Raising the federal minimum wage to $15 by 2024 would life pay for nearly 40 million workers, by David Cooper (2/5/19) covers their analysis of raising the minimum wage.  Their graph here shows the gap between the minimum wage and median wage over time. The report is lengthy and detailed. A few quick highlights:

Raising the minimum wage to $15 by 2024 would undo the erosion of the value of the real minimum wage that began primarily in the 1980s. In fact, by 2021, for the first time in over 50 years, the federal minimum wage would exceed its historical inflation-adjusted high point, set in 1968.

All told, raising the minimum wage to $15 by 2024 would directly or indirectly lift wages for 39.7 million workers, 26.6 percent of the wage-earning workforce.

Indexing the minimum wage to the median wage would ensure that low-wage workers share in broad improvements in U.S. living standards and would prevent future growth in inequality between low- and middle-wage workers.

The article has over 20 graphs/charts/tables and each one has the associated data.  The report does include “a discussion of the research on the likely effects such a raise would have on businesses, employment, and low-wage workers’ welfare.”

How well do you know Antarctica?

Monthly average sea surface temperatures in the Southern Ocean around Antarctica from 1850–2017, based on NOAA’s ERSSTv5 data set. Analysis by Climate Reanalyzer, University of Maine Climate Change Institute.


The Climate.gov article Antarctica is colder than the Arctic – but it’s still losing ice by Michon Scott (3/121/19) is a detailed primer on Antarctica and it’s relation to climate change. Some basic facts about Antarctica:

Thanks to thick ice, Antarctic elevation averages more than 6,000 feet (more than a mile above sea level). The very highest parts of the ice sheet, near the center of East Antarctica, rival the height of its tallest mountains, at nearly 13,500 feet.

Antarctica’s interior gets so little precipitation that it counts among the world’s driest deserts. Air masses reaching the high-elevation interior are usually stripped of moisture. The U.S. Antarctic Program reports that, continent-wide, Antarctica receives an average of roughly 2 inches of precipitation per year. (Phoenix, Arizona, gets about 7.5 inches of annual precipitation.)

Is Antarctica warming? It’s complicated:

The Intergovernmental Panel on Climate Change (IPCC) synthesis report published in 2014 found a warming trend over Antarctica, but expressed low confidence that the warming was caused by human activities. In the late twentieth century, the ozone hole and its effects on air circulation may have partly shielded the continent from the global warming influence of greenhouse gas emissions. Continued success in addressing the ozone hole, along with fossil fuel emissions, may cause Antarctic temperatures to rise more rapidly in future decades.

West of the Antarctic Peninsula, measurements dating back to the 1950s show a strong warming trend in the upper ocean: nearly 2.7°F. Meanwhile, waters of the Arctic Circumpolar Current (ACC), far below the surface, have warmed faster than the rest of the global ocean. Between depths of 1,000 and 3,000 feet, ACC temperatures rose by 0.11°F per decade between the 1960s and the 2000s. Between the 1980s and 2013, ACC temperatures at those depths rose by 0.16°F per decade.

What about ice melting?

In contrast with the Arctic—where climate change is amplified, and sea ice shows a clear declining trend over time—Antarctic sea ice does not show a significant overall trend in either the summer or the winter. One region, south and west of the Antarctic Peninsula, has shown a persistent decline, but this trend is small relative to the high variability of the other Antarctic sea ice regions. In 2015, sea ice experts concluded that the small gains in Antarctic sea ice in some seasons were not enough to cancel out Arctic losses, and so globally, sea ice was declining. That basic conclusion remains true in early 2019.

But what if all the ice on the continent melted?

If the entire Antarctic Ice Sheet were to melt at once, it would raise global sea level more than 180 feet. Outside of an epic natural disaster such as an asteroid slamming into Antarctica, that ice sheet isn’t going to melt entirely for centuries, but it will contribute to sea level rise over the next century. The question is: How much? The exact answer is elusive. The IPCC Fifth Assessment Report (AR5) states that the effect of Antarctic ice sheets on sea level rise over the coming century is a major unknown. Not only is the ice sheet melt rate challenging to measure precisely, but other events could accelerate sea level rise, and it’s hard to know when or even if those events will occur.

Read the article and get to know Antarctica. The is ample stats and QL classroom opportunities and graphs in the article.


What are the gender trends in graduate school?

The Council of Graduate Schools (CGS) report, Graduate Enrollment and Degrees 2007 to 2017 (Oct 2018) provides data on enrollment and degrees in graduate school by gender and race.  For example, the graph here is Figure 2 in their report and provides enrollment data by field of study and  gender.  In the aggregate they note:

Academic year 2016-17 marked the eighth consecutive year in which women earned the majority of degrees awarded at the doctoral level. Women earned 64.0% of graduate certificates awarded in 2016-17, 57.3% of master’s degrees, and 53.0% of doctorates.

The report contains a number of graphs and data tables with various  demographic information (race, gender, international). For example,

Among first-time U.S. citizens and permanent resident graduate students in the Fall of 2017, about 23.9% were underrepresented minorities, including American Indian/Alaska Native (0.5%), Black/African American (11.9%), Native Hawaiian/Other Pacific Islander (0.2%), and Hispanic/Latino (11.3%) (Table B.11).

A summary page of the report, First-Time Enrollment Holds Steady – Application Counts Slightly Decline at U.S. Graduate Schools, also has a link to the full pdf report.