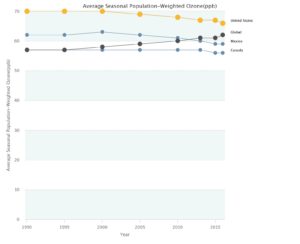
 The State of Global Air 2018 has an interactive air pollution graph to compare countries and regions. Graph and data are both available. For example, the graph here is Average Seasonal Population-Weighted Ozone (ppb) for Canada, Mexico, and the U.S. (in yellow), as well as the global average (in black). We can select ambient particulate matter pollution and household air pollution from solid fuels, along with most countries or regions. There is also a tab for health impact as the number of deaths (this is not a rate so larger countries will likely have more deaths) related to the particular air pollution for the selected country. The State of Global Air 2018 explains their methods, has a full report, and maps.
Where does the U.S. rank on the world press freedom index?
 According to the Reporters Without Borders index, the U.S. ranks 45 (out of 180) in 2018, just behind Romania and South Korea. Here is what they have to say about the U.S.
US press freedom, enshrined in the First Amendment to the 1787 constitution, has been under increasing attack over the past few years, and the first year of President Donald J. Trump’s presidency has fostered further decline in journalists’ right to report. He has declared the press an “enemy of the American people” in a series of verbal attacks toward journalists, attempted to block White House access to multiple media outlets, and routinely uses the term “fake news” in retaliation for critical reporting. He has even called for revoking certain media outlets’ broadcasting licenses. The violent anti-press rhetoric from the highest level of the US government has been coupled with an increase in the number of press freedom violations at the local level as journalists run the risk of arrest for covering protests or simply attempting to ask public officials questions. Reporters have even been subject to physical assault while on the job. It appears the Trump effect has only amplified the disappointing press freedom climate that predated his presidency. Whistleblowers face prosecution under the Espionage Act if they leak information of public interest to the press, while there is still no federal “shield law” guaranteeing reporters’ right to protect their sources. Journalists and their devices continue to be searched at the US border, while some foreign journalists are still denied entry into the US after covering sensitive topics like Colombia’s FARC or Kurdistan.
You can download their data and since the rankings stared in 2002 you might be able to get access to past data (some of it is available in their archives). Their methodology is explained and they have an interactive map.
How many Billion dollar weather/climate disasters occur in the U.S. each year?
 NOAA has your answer on their Billion-Dollar Weather and Climate Disasters: Time Series page. The page includes an interactive version of the graph here that allows you to select disaster types and adjust for CPI. The data is available to download.
Determining the cost of disasters is not simple and they note:
In May 2012, NOAA’s National Centers for Environmental Information — then known as National Climatic Data Center (NCDC) — hosted a workshop including academic, federal, and private sector experts to discuss best practices in evaluating disaster costs.
A research article “U.S. Billion-dollar Weather and Climate Disasters: Data Sources, Trends, Accuracy and Biases” (Smith and Katz, 2013) regarding the loss data we use, our methods and any potential bias was published in 2013. This research article found the net effect of all biases appears to be an underestimation of average loss. In particular, it is shown that the factor approach can result in an underestimation of average loss of roughly 10–15%. This bias was corrected during a reanalysis of the loss data to reflect new loss totals.
A climate.gov post by Deke Arndt (4/13/18) , The all things being equal edition, discusses the connection between weather and climate:
Relative sea level in and around Boston has risen about half a foot in the last 50 years. So, all else being equal, the same storm 50 years ago would have six inches less water to push inland. That’s a big, big difference, and one that has developed on the climate scale.
That’s how climate comes in, even in these weather events. Many times, in the discussion of weather and climate, we mistakenly consider these two words, and the concepts they define, to be mutually exclusive frames.
How much are we working?
Our World in Data has your answer with the article , Working Hours.
The researchers Michael Huberman and Chris Minns published estimates of weekly work hours going back to the late 19th century. This data – shown in the following visualization – shows that over this time working hours have steeply declined. Full-time workers in these countries work 20 or even 30 hours less every week than in the 19th century.
As always with Our World in Data, they have interactive graphs that can be downloaded (such as the one here – you also have choices of countries) along with the data set. The article has a total of six interactive graphs and data related to work, productivity, income, and gender.
What are the differences in infant mortality by race?
 The NYT has a lengthy article, Why America’s Black Mothers and Babies Are in a Life-or-Death Crisis (4/11/18 by Linda Villarosa) and Kevin Drum follows this up with the handy chart posted here in his post Our Disgraceful Infant Mortality Epidemic. He notes that although infant morality has decreased the difference between Black and White infant morality has increase (by percentage):
In 1950, according to the CDC, the black rate of infant mortality was 64 percent higher than the white rate. Today it’s 133 percent higher
We also aren’t keeping up with the rest of world:
In 1960, we ranked 11th in infant mortality among rich countries. Not great, but not terrible. Today we rank 24th out of 27 rich countries, ahead of only Turkey, Mexico, and Chile.
You can find infant mortality data at the CDC’s National Center for Health Statistics page (tables 10-13).
Are teachers being paid fairly?
 An August 2016 report by EPI, The teacher pay gap is wider than ever (8/9/16 by Allegretto and Mishel), suggests not. For instance, the graph here shows that teachers are paid 23% less than other college graduates in 2015 and the gap has been increasing since 1980.
Average weekly wages (inflation adjusted) of public-sector teachers decreased $30 per week from 1996 to 2015, from $1,122 to $1,092 (in 2015 dollars). In contrast, weekly wages of all college graduates rose from $1,292 to $1,416 over this period.
For all public-sector teachers, the relative wage gap (regression adjusted for education, experience, and other factors) has grown substantially since the mid-1990s: It was ‑1.8 percent in 1994 and grew to a record ‑17.0 percent in 2015.
The report includes 8 graphs with data plus two tales. There are comparisons between females and males, as well as union and non-union.
What is known about world income inequality?
 The World Inequality Report 2018 provides a complete summary of world income inequality. The executive summary contains thirteen charts to explore such as the one here.
The poorest half of the global population has seen its income grow significantly thanks to high growth in Asia (particularly in China and India). However, because of high and rising inequality within countries, the top 1% richest individuals in the world captured twice as much growth as the bottom 50% individuals since 1980 (Figure E4). Income growth has been sluggish or even zero for individuals with incomes between the global bottom 50% and top 1% groups. This includes all North American and European lower- and middle-income groups.
The executive summary also notes:
Research has demonstrated that tax progressivity is an effective tool to combat inequality. Progressive tax rates do not only reduce post-tax inequality, they also diminish pre-tax inequality by giving top earners less incentive to capture higher shares of growth via aggressive bargaining for pay rises and wealth accumulation. Tax progressivity was sharply reduced in rich and some emerging countries from the 1970s to the mid-2000s. Since the global financial crisis of 2008, the downward trend has leveled off and even reversed in certain countries, but future evolutions remain uncertain and will depend on democratic deliberations. It is also worth noting that inheritance taxes are nonexistent or near zero in high-inequality emerging countries, leaving space for important tax reforms in these countries.
The methodology page includes files with all the data.
How do NYC securities employee bonuses compare to U.S. household income?
 Statista has your answer with their post Wall Street Bonuses Outpace Household Income (3/28/18 by Dyfed Loesche) and their chart here.
Compared to the average U.S. household income this is quite some money, keeping in mind these are payments on top of the regular pay. In 2016, the average Wall Street bonus stood at close to $158,000 and thus 2.5 times as high as the median household income of a little more than $59,000. (The U.S. Census Bureau has not yet released official household figures for 2017). The average number of people living in an American household stands at 2.5.
The post has links to the median household data as well as the bonuses. Not only is this useful data for a stats course, but there is also an interesting discussion to be had on the use of mean and median in this post.
What is the connection between race and generational income mobility?
 The recent paper, Race and Economic Opportunity in the United States: An Intergenerational Perspective, by the Equal Opportunity Project, has the answer and makes the data available. The executive summary has seven key findings, here are three:
Finding #1: Hispanic Americans are moving up in the income distribution across generations, while Black Americans and American Indians are not.
Finding #2: The black-white income gap is entirely driven by differences in men’s, not women’s, outcomes.
Finding #6: Within low-poverty areas, black-white gaps are smallest in places with low levels of racial bias among whites and high rates of father presence among blacks.
There is something in this paper to challenge everyone’s views at some point. For example,
We find analogous gender differences in other outcomes: black-white gaps in high school completion rates, college attendance rates, and incarceration are all substantially larger for men than for women. Black women have higher college attendance rates than white men, conditional on parental income.
At the bottom of the executive summary are links to data, slides, and the full paper. You can go directly to the data here.
Is wage inequality growing?
 The EPI article, The State of American Wages 2017 by Elise Gould, has a full summary of growing wage inequality. A few of their key findings:
From 2000 to 2017, wage growth was strongest for the highest-wage workers, continuing the trend in rising wage inequality over the last four decades.
While wage inequality has generally been on the rise for both men and women, wage inequality is higher and growing more among men than among women.
At every decile and at the 95th percentile, wage growth since 2000 was faster for white and Hispanic workers than for black workers.
This is an in depth article with over 30 bullet points of key findings. There are numerous graphs, such as the on posted here, with data sets. The cumulative graph here is broken into female and male graphs farther down in the article. What you will find is that, for example, the increase in the median wages is almost entirely due to increases in the median female wage (7.9% since 2000). There is a lot to learn in this post and plenty of material for courses.