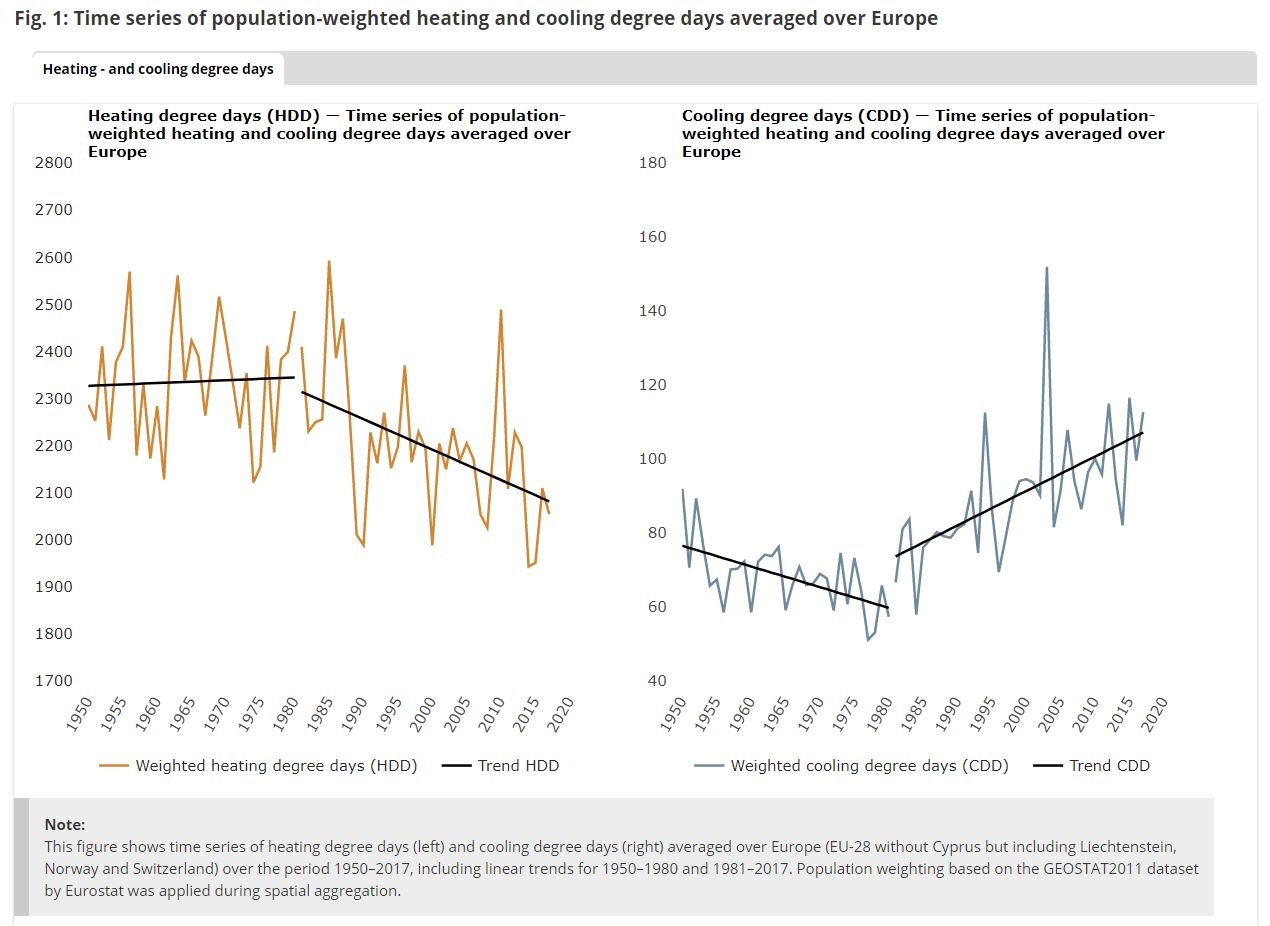
Tag Archives: data source

How do we get information about record setting weather events?

NOAA has an online tool, Data Tools: Daily Weather Records, that has a summary of daily, monthly, and all time weather records for the last 7, 30, and 365 days, as well as month to date and year to date. For instance, so far this year there have been 12,868 daily precipitation records set in the U.S. There is also a tool to select a time period and event. For example, from 5/21/2019 to 5/27/2019 there where 757 daily high precipitation records set.  The tool provides a map (copied here for this query) and a list of the stations with sortable records. For instances, in this time period the most rain was in Pawnee, OK which had 9.52 inches of rain breaking the previous record of 3.20 inches set on 5/21/1977.

Some details about the data:

For a station to be considered for any parameter, it must have a minimum of 30 years of data with more than 182 days complete each year.

These data are raw and have not been assessed for the effects of changing station instrumentation and time of observation.


Are there correlations between one or more deceased parents and race, gender, or socio-economic status?

The Census Bureau report Parental Mortality is Linked to a Variety of Socio-economic and Demographic Factors by Zachary Scherer (5/6/19) provides charts of deceased parent(s) by sex, race (chart copied here), and socio-economic status.

For example, among those ages 45 to 49, 26% have lost their mother, while 45% have lost their father. Along these same lines, 7 in 10 of those ages 60 to 64 have a deceased mother, while about 87% have lost their father.

For example, among those ages 35 to 44, 43% of those living below the FPL have lost one or both parents, compared to 28% for those living in households with an income-to-poverty ratio of at least 400% of the FPL.

Parental loss, which varies by race and socio-economic status, is often accompanied by psychological and material consequences. These statistics demonstrate the way these new SIPP data can help assess how socio-economic and demographic characteristics are associated with parental mortality in the United States.

There are two other charts and a link to the SIPP data source.


Where can we get state energy data?

The EIA has a new portal for state energy information. The new portal is introduced in the post New EIA Product Expands Access to State and Regional Energy Information by Stacy Angel and Pauline George (5/16/19).

EIA’s new State Energy Portal provides greater access to more state-level U.S. energy data with interactive, customizable views of more than 150 charts, tables, and maps. Infographics show the overall energy context for the states; state rankings provide a way to compare states. Users can download charts and embed them in their websites.

For example, the chart here is from the new portal. It is natural gas consumption by sector in New York from 2014 through Feb. of  2019. Notice the relationship between residential and electric power. Quiz question: Why does residential and electric power peak at opposite time of the year? The choices for this individual data set included a time range dating back to 1990, stacked bar chart, or table. The data is also available. Choose a state, an energy product, and explore.

What are the economic prospects for 2019 college grads?

The yearly EPI report on economic prospects for young college grads Class of 2019 College Edition by Elise Gould, Zane Makhiber, and Julia Wolfe (5/14/19) is now available. The report has 19 key finding and 10 graphs with available data. A few highlights:

Women make up half of 21- to 24-year-olds but well over half (57.4 percent) of young college degree holders.

One out of every 20 young college graduates is unemployed, a higher rate than in 2000, when only one in 25 was.

After falling in the aftermath of the Great Recession, wages for young college graduates have been growing steadily since 2014 and have (just barely) surpassed the 2000 benchmark; however, nearly two decades of wage growth for young college graduates have been lost.

Related Post: What are the prospects for new college grads? (5/21/18)

Does the U.S. import or export natural gas?

The title of the EIA post (5/2/19) says it all, United States has been a net exporter of natural gas for more than 12 consecutive months. In short,

U.S. net natural gas exports in February 2019 totaled 4.6 billion cubic feet per day (Bcf/d), marking 13 consecutive months in which U.S. natural gas exports exceeded imports. The United States exports natural gas by pipeline to both Canada and Mexico and increasingly exports liquefied natural gas (LNG) to several other countries.

Note the units, that is 4.6 billion cubic feet per day.  The eia has links to the data.

In a related post How much coal does the U.S. export? this question was posed:  If a country removes fossil fuels from the ground, how complicit are they in the CO2 emissions of those fuels even if they aren’t the ones burning it?

How has the U.S. ranking in the world press freedom index changed since 2018?

Reporters without Borders releases a world press freedom index each year. The U.S. dropped three spots to 48 out of 180 countries and is considered a “problematic situation.”

The RSF Index, which evaluates the state of journalism in 180 countries and territories every year, shows that an intense climate of fear has been triggered — one that is prejudicial to a safe reporting environment. The hostility towards journalists expressed by political leaders in many countries has incited increasingly serious and frequent acts of violence that have fueled an unprecedented level of fear and danger for journalists.

If the political debate slides surreptitiously or openly towards a civil war-style atmosphere, in which journalists are treated as scapegoats, then democracy is in great danger,” RSF secretary-general Christophe Deloire said. “Halting this cycle of fear and intimidation is a matter of the utmost urgency for all people of good will who value the freedoms acquired in the course of history.

The site includes the downloadable 2019 data, an interactive map, and the main article also has a couple of graphs.

Related post: Where does the U.S. rank on the world press freedom index?

Opioid prescription, grandparents raising grandchildren, a connection?

The Census Bureau report States With High Opioid Prescribing Rates Have Higher Rates of Grandparents Responsible for Grandchildren by Lydia Anderson (4/22/19) draws a connection:

In the wake of the opioid epidemic that was declared a public health crisis in 2017, there has been increasing concern about what happens to the children of parents with substance abuse disorders who may be unable to care for their children.

New Census Bureau research shows that grandparents may sometimes step in to care for these children.

According to the report the states with the highest opioid prescription rates are Alabama (121 per 100 residents), Arkansas (114.6), Tennessee (107.5), Mississippi (105.6) and Louisiana (98.1). These states represent four of the top 5 states where the percentage of the population age 30 and over are raising grandchildren.  The article has a companion map to the map of opioid prescription rates copied here with rates of grandparents raising grandchildren.  There are also links to the data.

Are there tornado trends?

The Climate Central post Shifting Tornado Zones (4/24/19) provides a map of changes in the number of tornadoes since 1979 (copied here).

Let’s be clear, tornadoes are not going away in the Plains and Upper Midwest, but more have been recorded east of the Mississippi. While there are connections to climate variability modes like ENSO, these overall trends are consistent with an eastward shift in the drier climate zone of the western U.S. and with climate change projections indicating that severe storm environments will become more common in the eastern U.S.

The number of tornadoes in large tornado outbreaks is also on the rise.

In addition to the changing geography and number of tornadoes, there is a shift in the time of year they occur.

Extensive tornado data can be found at TornadoHistoryProject.com.  Related posts: When and where do tornadoes occur?  Are tornadoes on the rise in the U.S.?

What is the state of Arctic Ice?

The melting season for Arctic Sea Ice has started with a quick drop in ice. The total ice is at a record low for this time of year (orange line in chart). But, how this plays out throughout the melting seasons is hard to predict based solely on past seasons. For instance, 2012 is the year of the record low (dashed line), but numerous seasons have been lower than 2012 at this time of year (2016 – yellow, 2015 – green, 2007 – blue shown here).  Arctic Sea Ice extent is updated daily on the Charctic Interactive Sea Ice Graph by NSIDC. This graph allows the user to select years, download the image, and choose between Arctic and Antarctic ice extent. NSIDC posts the data and there is a project on both the Calculus and Statistics page using this data, as well as an interactive graph.

How much money do migrants send home to individuals?

Pew has an interactive graph on their Remittance flows worldwide in 2017 page where you can select a country and either outgoing or incoming. The result is get a map of how much money was sent to other countries or came into the country. For example, the graph here is for money sent from the U.S. to other countries. Along with the map, a table of data is updated to match the selection on the map.  A related Pew article, Immigrants sent a record amount of money home to sub-Saharan African countries in 2017 by Abby Budiman and Phillip Connor (4/3/19), highlights this data.

Money sent by immigrants to their home countries in sub-Saharan Africa reached a record $41 billion in 2017. This represents a 10% jump in remittances from the previous year, the largest annual growth for any world region, according to a Pew Research Center analysis of World Bank data.

Worldwide, immigrants sent a record $625 billion (in 2018 U.S. dollars) back to their home countries in 2017, a 7% increase from the previous year.